The New Hampshire Solid Waste Working Group (SWWG) held its most recent meeting at the end of April. It was a particularly interesting for those trash nerds among us as John Culbertson, Vice President at MSW Consultants, gave a detailed presentation sharing the key results from NH's first ever Waste Characterization Study.
The final report is expected to be issued in the coming weeks, so this was our first opportunity to review the findings.
There are some important nuances to keep in mind as we reviewed the presentation. First, the study only looked at waste disposed of in NH that comes from NH, so it's important to keep in mind this doesn't reflect any out of state waste.
The study also only covered municipal solid waste and construction and demolition debris, which means it didn't include industrial waste, hazardous waste, sludge, etc. The C&D inspections were visual rather than manual sorting, so small items like batteries can't effectively be noted.
John also cautioned us against comparing the results of this study to EPA's national numbers because the NH results were site-based and statistically significant, whereas the EPA numbers are based on industry self-reporting. In addition, once you move beyond common curbside recyclables (glass, plastic, cardboard, aluminum cans, etc.), it's difficult to compare NH results to other state results, as the non-curbside items lack standard definitions.
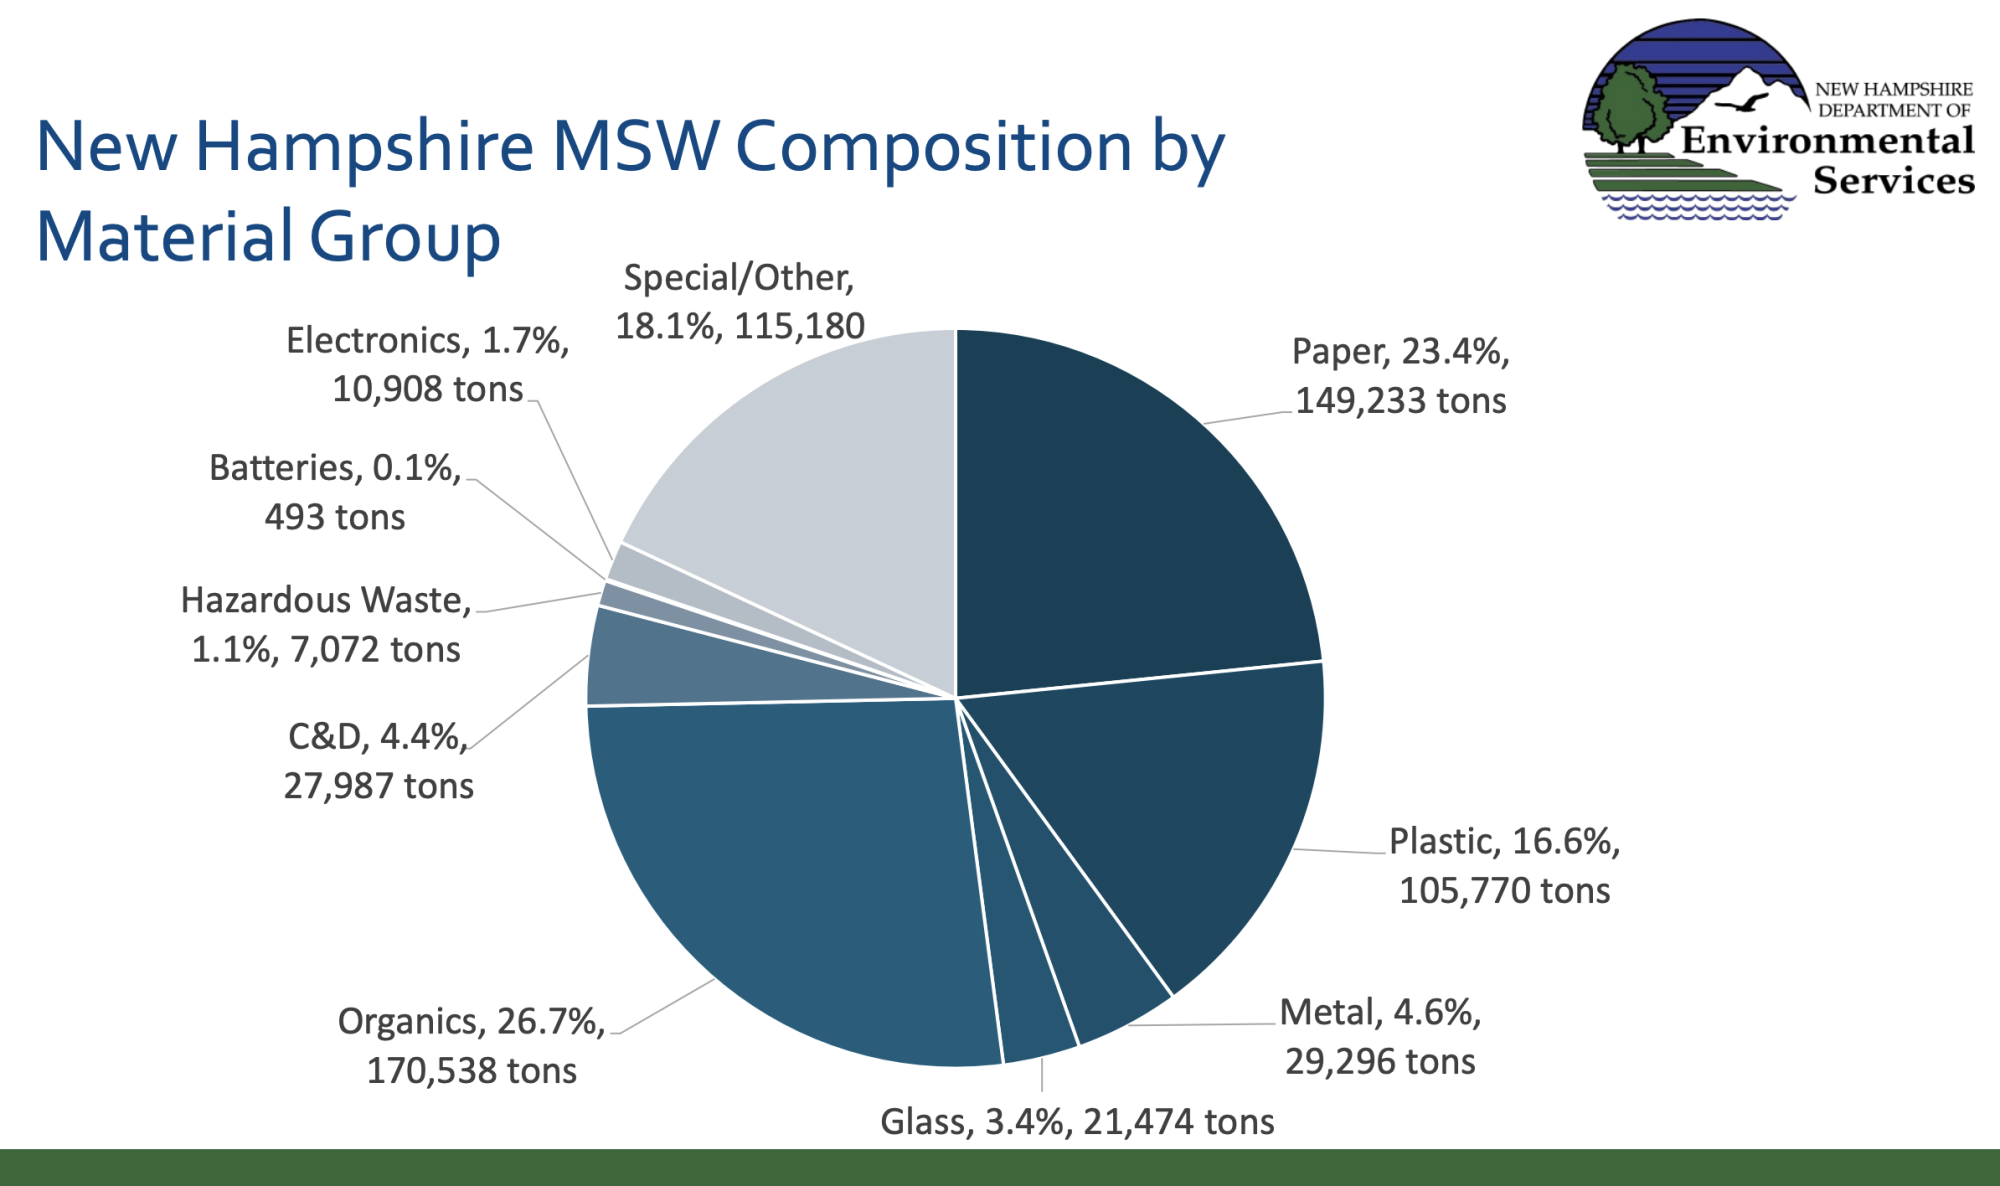
The combined pie chart below is the best overall snapshot showing both MSW and C&D composition.

Looking at the combined pie chart, we can see that the largest five components of our waste being disposed in NH are C&D (27.7%), organics (18.5%), paper (16.7%), special/other (16.1%), and plastic (11.8%). The Other/Special category includes items like diapers, pet waste, textiles, bulky furniture, etc.
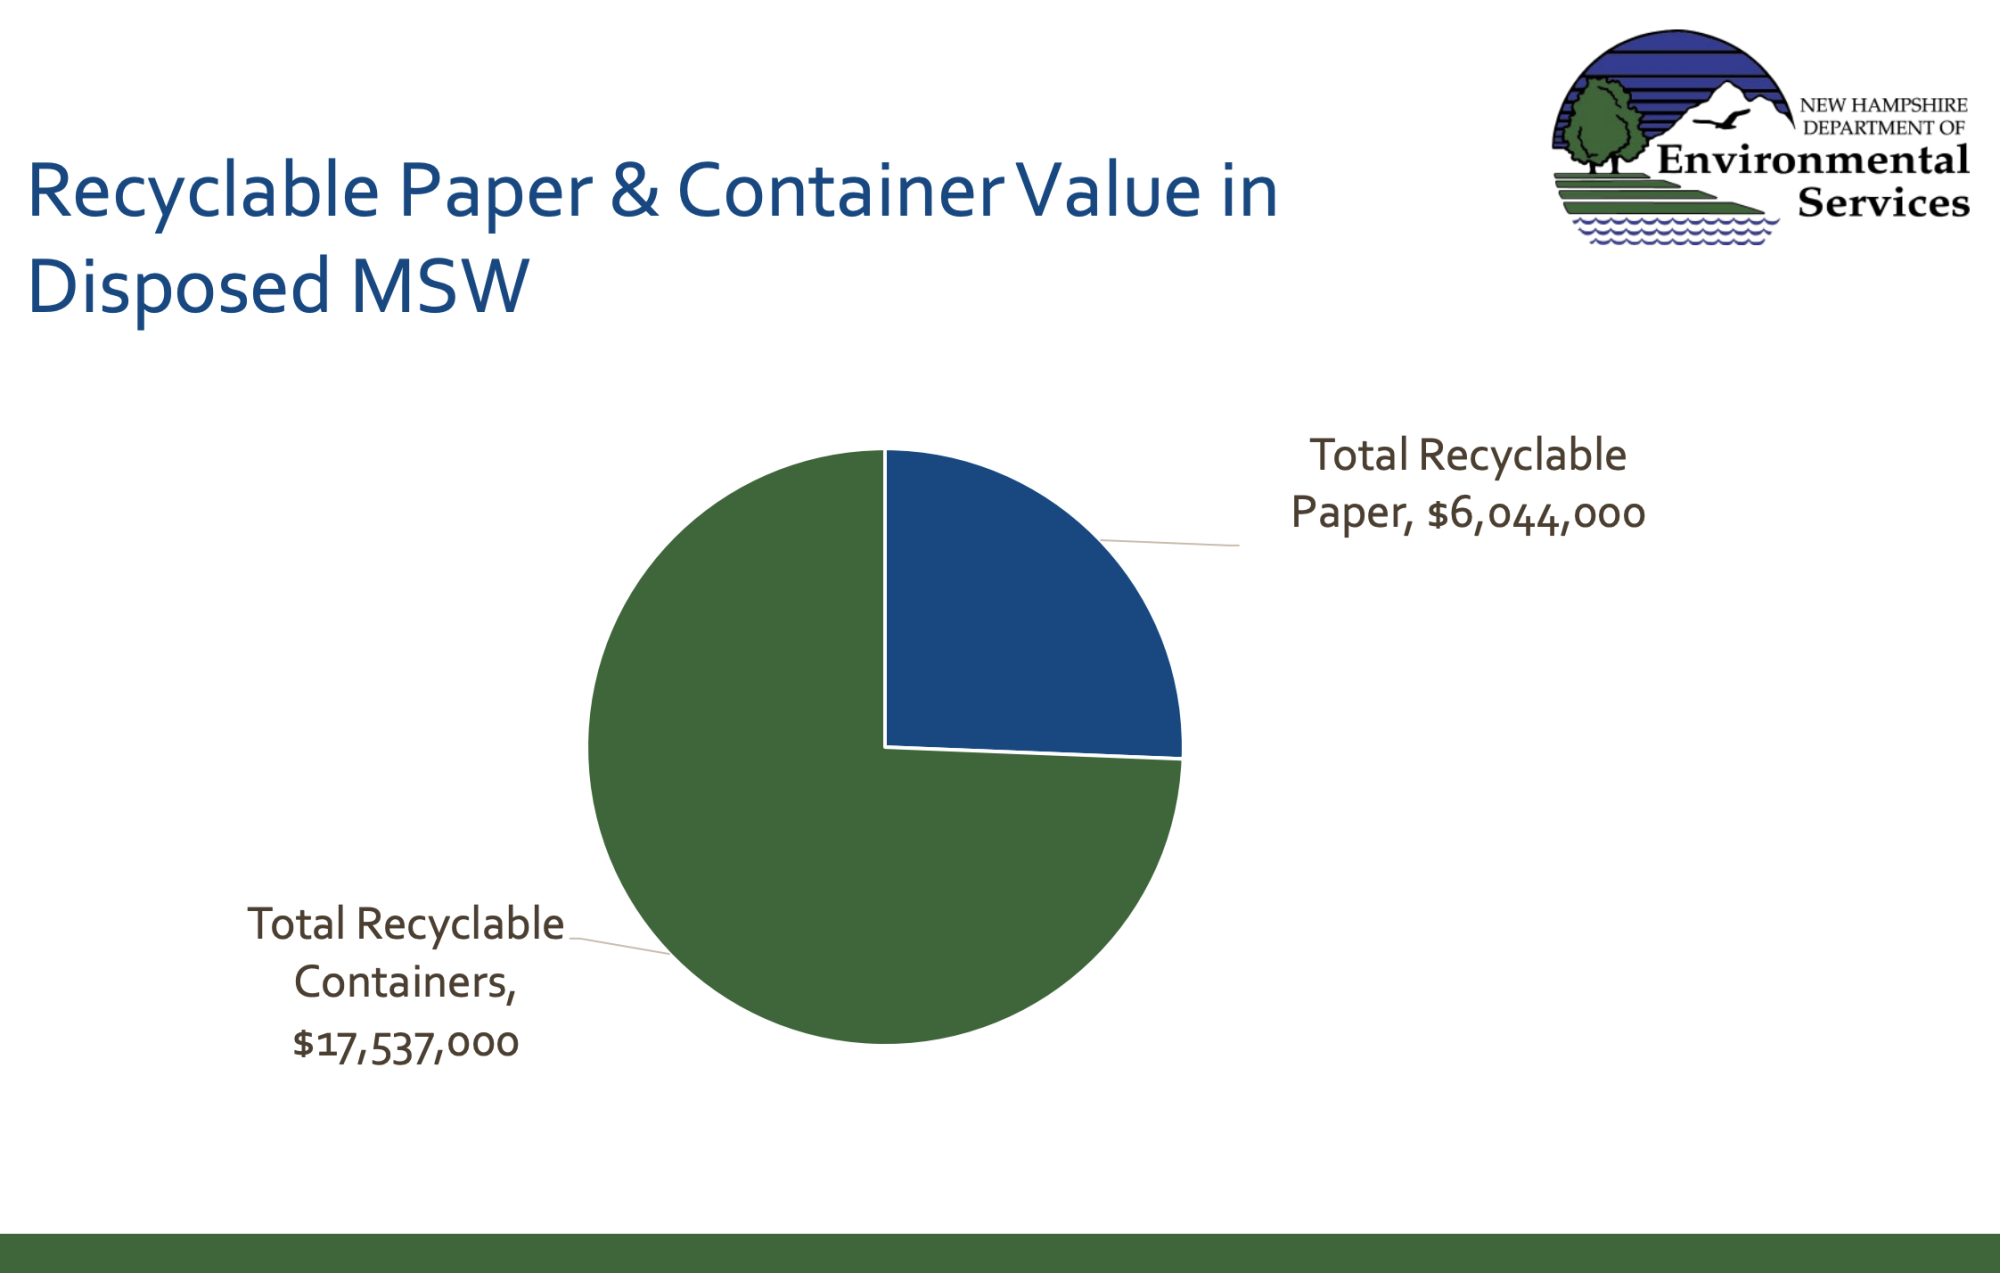
It is also interesting to note the potential economic impact of not diverting paper and containers, with millions of dollars lost to the trash.
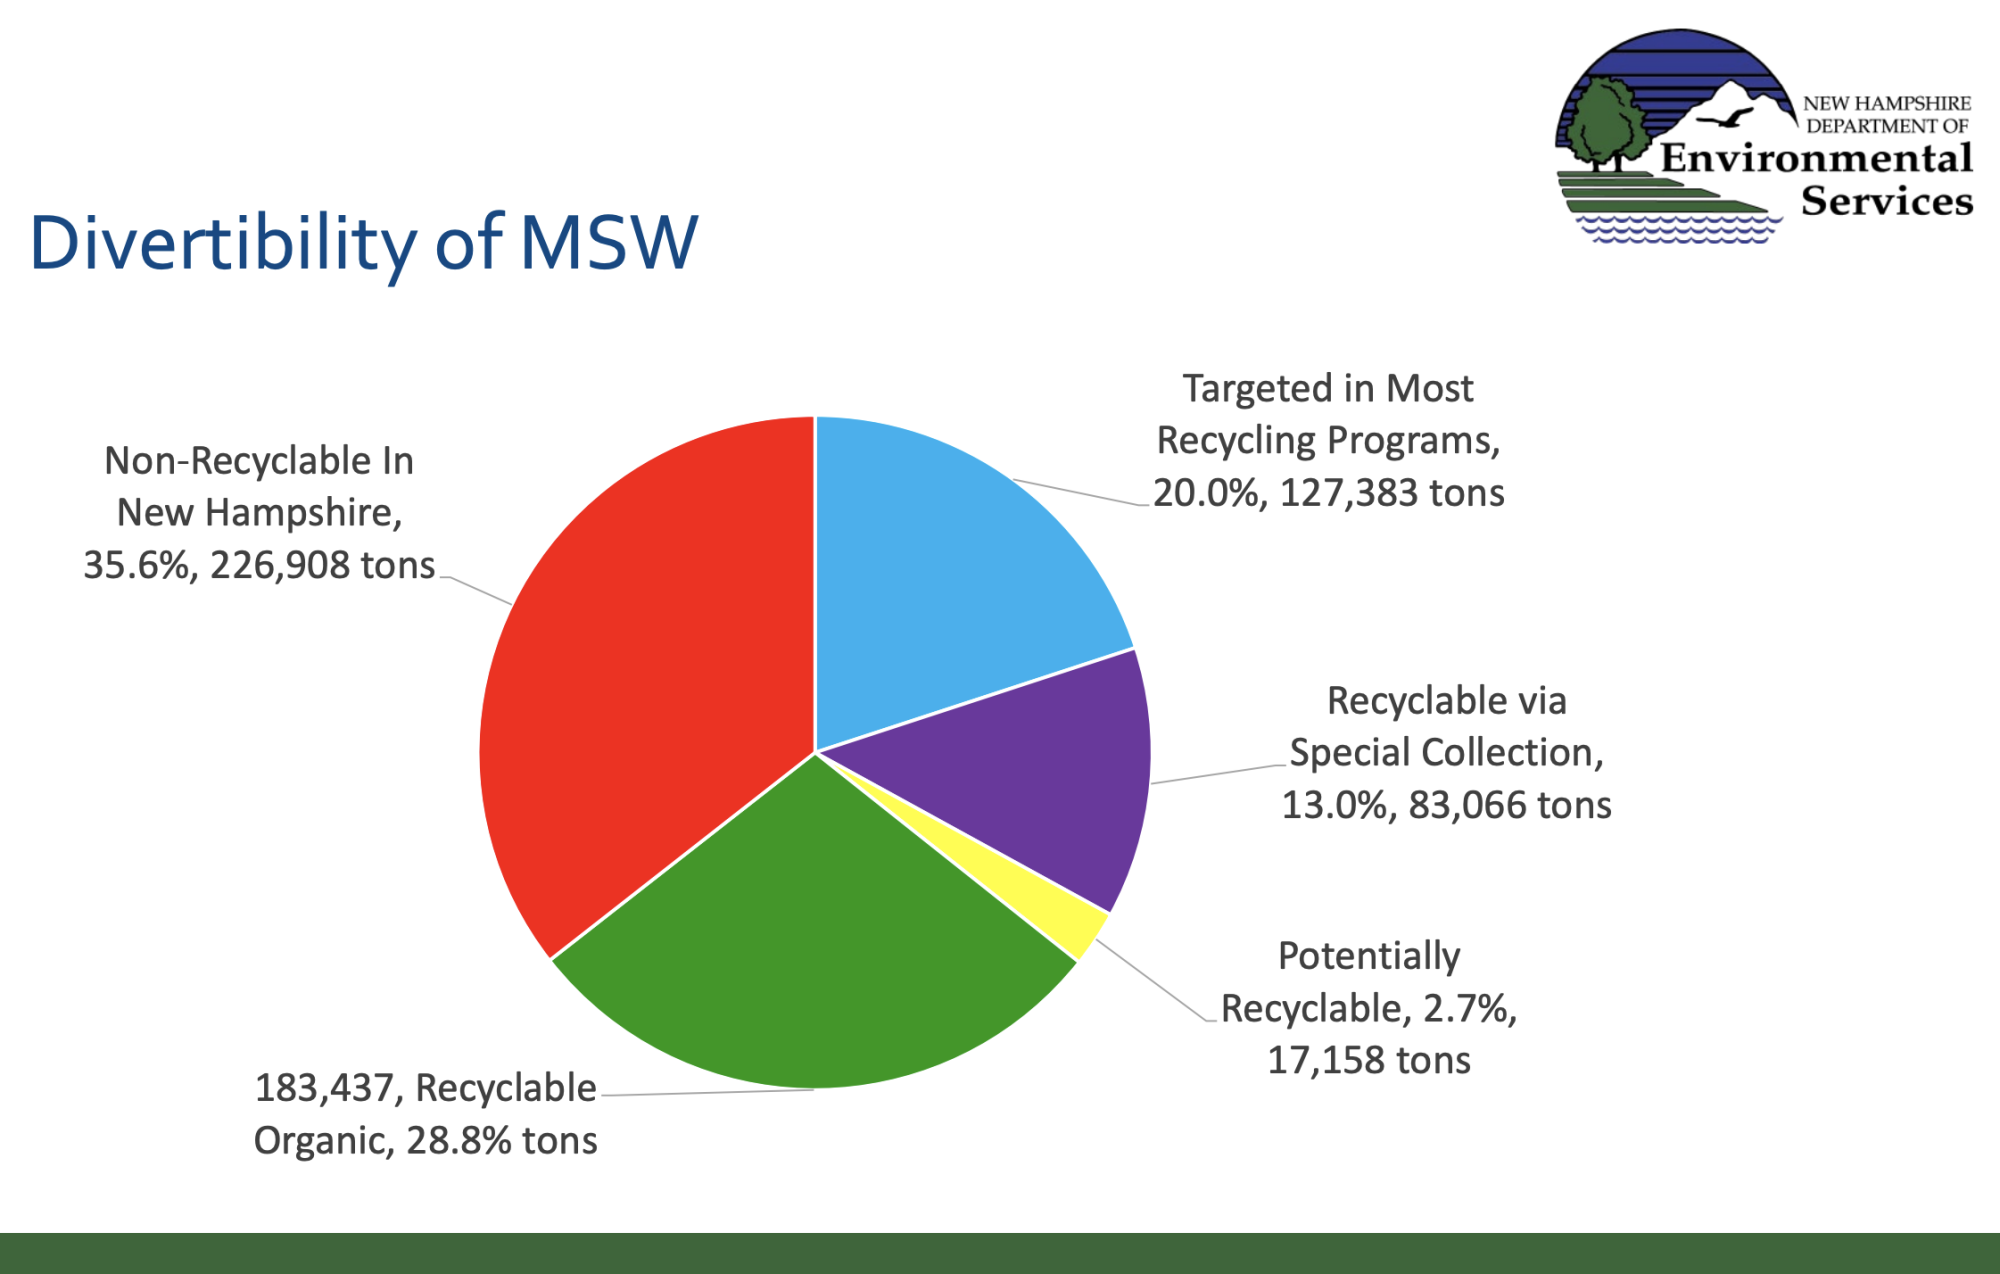
Based on the results, some of the recommendations by MSW Consultants is for NH to focus on:
increasing participation in existing recycling programs
organics diversion, primarily food scraps
textiles diversion